
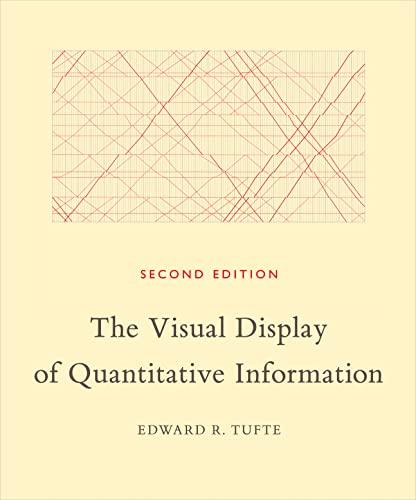
The Visual Display of Quantitative Information, 2nd Ed.
Edward R. Tufte
ISBN 10: 0961392142 ISBN 13: 9780961392147
Published by Graphics Pr, 1997
Used
Hardcover
From
ThriftBooks-Atlanta, AUSTELL, GA, U.S.A.
Seller rating 5 out of 5 stars

AbeBooks Seller since 24 March 2009
This specific item is no longer available.
About this Item
Description:
Missing dust jacket; May have limited writing in cover pages. Pages are unmarked. ~ ThriftBooks: Read More, Spend Less. Seller Inventory # G0961392142I4N01
Synopsis:
The classic book on statistical graphics, charts, tables. Theory and practice in the design of data graphics, 250 illustrations of the best (and a few of the worst) statistical graphics, with detailed analysis of how to display data for precise, effective, quick analysis. Design of the high-resolution displays, small multiples. Editing and improving graphics. The data-ink ratio. Time-series, relational graphics, data maps, multivariate designs. Detection of graphical deception: design variation vs. data variation. Sources of deception. Aesthetics and data graphical displays. This is the second edition of The Visual Display of Quantitative Information. This edition provides excellent color reproductions of the many graphics of William Playfair, adds color to other images, and includes all the changes and corrections accumulated during 17 printings of the first edition.
Synopsis: The first edition of Tufte's now classic text on the design of statistical graphics was published in 1983. Tufte published it himself with the help of a second mortgage in order to have complete control over the book's design, which he wanted to reflect the intellectual principles put forth in its c
"About this title" may belong to another edition of this title.
Bibliographic Details
Title: The Visual Display of Quantitative ...
Publisher: Graphics Pr
Publication Date: 1997
Binding: Hardcover
Condition: Very Good
Dust Jacket Condition: No Jacket
Edition: 2nd Edition